
Quick Highlights
| What It Is | Stepping through code manually to track every variable, every condition, every execution path |
| Origin | Formalized in the 1970s–80s as “structured walkthrough” in software engineering |
| Who Uses It | Beginners in classrooms, senior devs in complex codebases, embedded systems engineers |
| Modern Relevance | AI agents now use trace observability tools — the old concept, turbocharged |
| Biggest Myth | “Just run the code and see what breaks” replaces this. It doesn’t. |
| Key Tools | WinDbg, TRACE32, IntelliJ Debugger, VS Code Debugger, LangSmith (for AI agents) |
| Bottom Line | You don’t understand something if you can’t track it. |
Here’s something that’ll rattle a few cages: most developers think they understand their own code. They don’t. They understand what the code outputs — which is a completely different thing. A trace walkthrough is how you close that gap. And almost nobody teaches it properly.
Let me back up.
What Even Is a Trace Walkthrough?
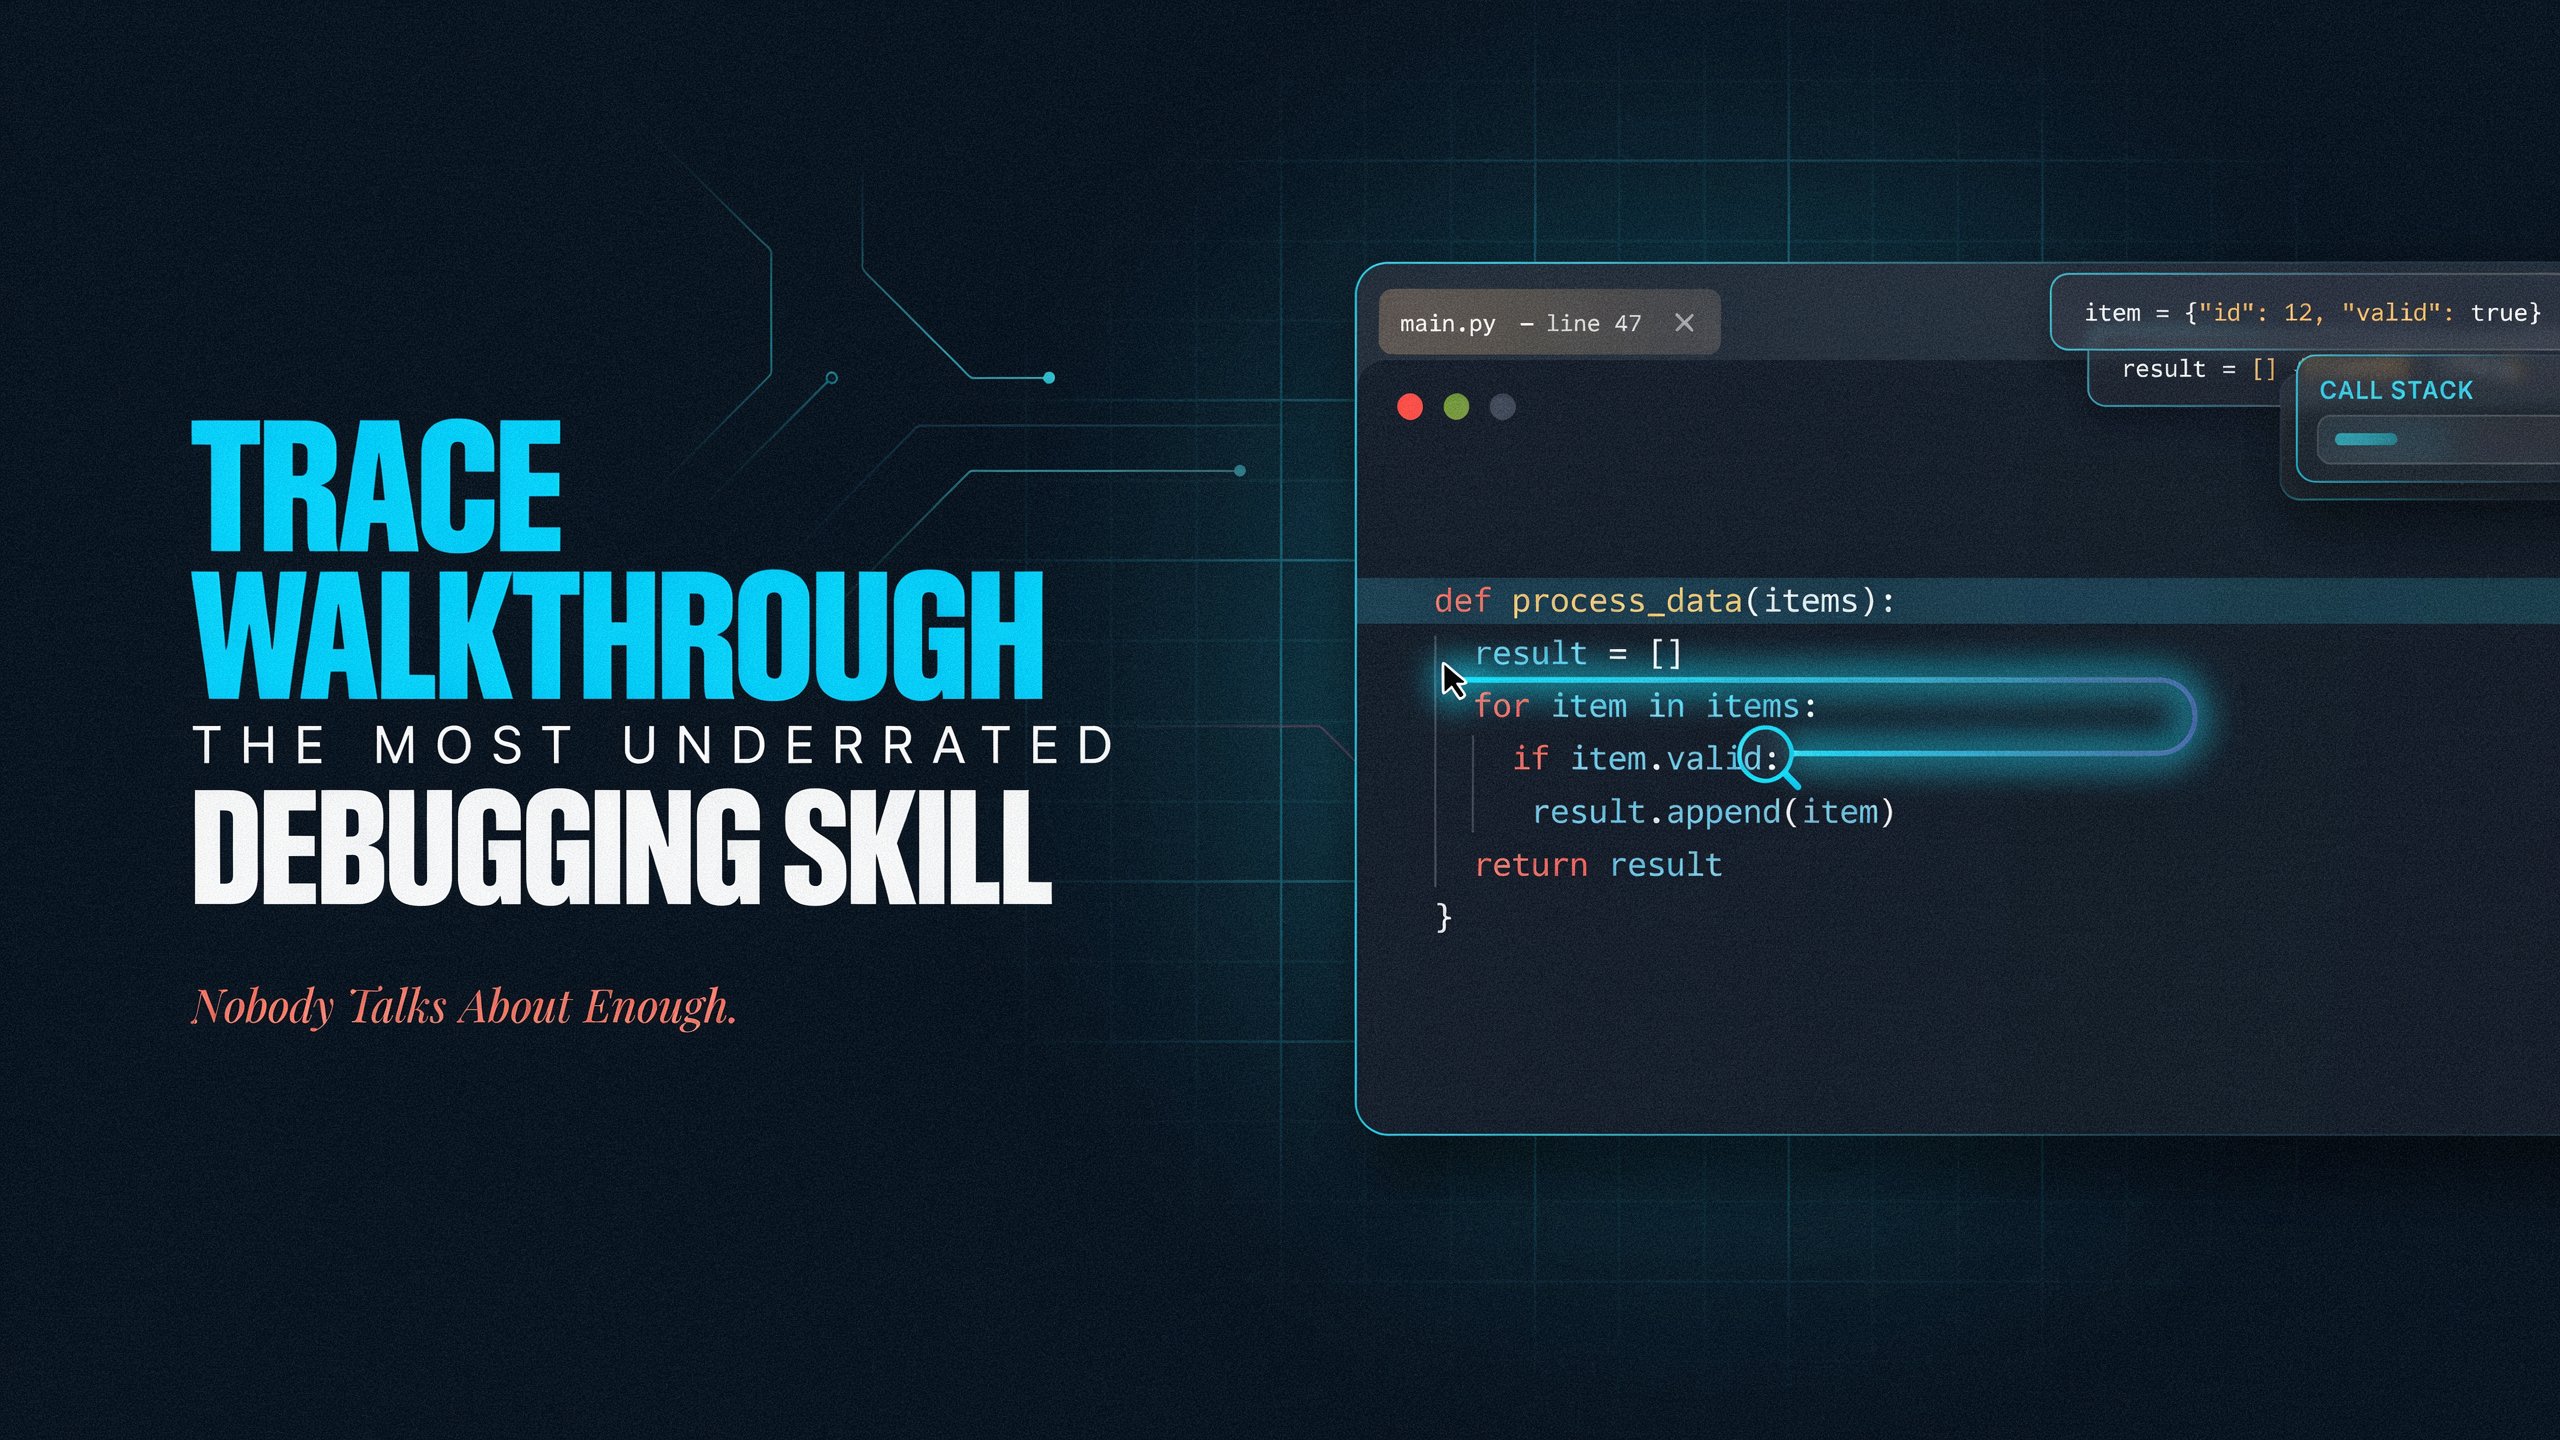
It sounds fancier than it is. At its core, a trace walkthrough is exactly what it sounds like — you walk through code, line by line, tracking what every variable holds at every single moment. No computer required. Sometimes just a pencil, paper, and enough coffee to keep your brain from skipping lines.
The idea is simple: you become the computer. You execute the logic in your head (or on paper), updating variable values as you go, noting when conditions branch, when loops repeat, when functions get called. You’re not running code — you’re reading it like a story you’re acting out.
This is also called hand-tracing. Old-school educators used it religiously. Some still do.
See also “The Media Bias Chart: A Clear-Eyed Look at Who’s Telling You the Truth“
Wait, Wasn’t This Invented in Like 1975?
Sort of, yeah. The formalized concept of a “structured walkthrough” got cemented in the 1970s and 1980s, when software engineering started getting serious about quality. Before that, peer review in software was borrowed loosely from editorial processes in publishing — editors catch what authors miss, and all that. IBM’s Michael Fagan put his name on a formal inspection method in 1976. The broader walkthrough concept followed.
The core idea then was the same as now: the person who wrote the code walks others through it. Everyone asks questions. Bugs surface. Assumptions get challenged.
It wasn’t glamorous. It still isn’t. But it worked. And crucially — it still works.
The Pencil-and-Paper Argument (That People Dismiss Too Fast)
Here’s where I’ll push back on conventional modern wisdom a bit.
Most people hear “trace walkthrough” and immediately think: why bother when VS Code debugger exists? Fair question. Wrong conclusion.
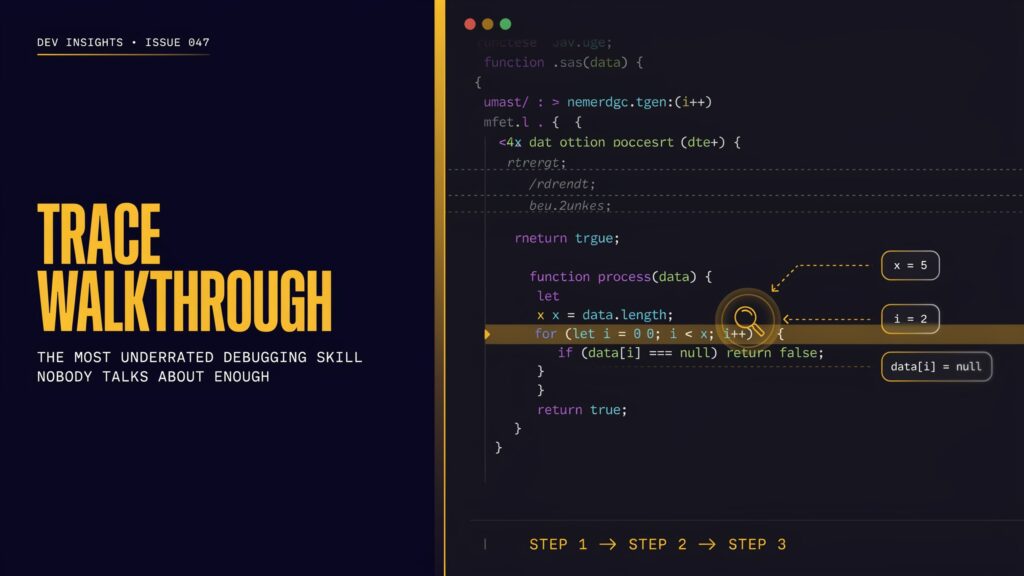
Running a debugger shows you what the code does at runtime. A manual trace walkthrough forces you to predict what the code will do before it runs. That’s a completely different cognitive exercise. One is passive observation. The other is active reconstruction.
Developers who learned to hand-trace code early tend to have stronger intuitions about bugs. They can look at a function and immediately sense where something might go sideways — before they ever hit the run button. That skill doesn’t come from staring at breakpoints. It comes from having repeatedly played the role of the machine yourself.
One developer on Medium wrote about spending an entire semester writing programs in a notebook — no computer. Sounds maddening, right? But he later described it as foundational. The physical act of crossing out old variable values and writing new ones underneath forced his brain to internalize execution flow in a way no IDE ever could.
There’s something there. Don’t dismiss it just because it’s analog.
The Three Flavors You’ll Actually Encounter
Not all trace walkthroughs look the same in practice. Roughly, they fall into three camps.
The manual kind. You, paper, pencil, code printed out or on a second monitor. You track variables in a little table. Loop iterations get noted. Branch conditions get checked manually. This is the purest form — and the most cognitively demanding.
The debugger-assisted kind. You use a tool like IntelliJ’s debugger or VS Code to step through code line by line, watching variables update in real time. You’re still “walking through” the code — just with automated bookkeeping. The key is you’re paying attention, not just letting the machine run to the end.
The formal team walkthrough kind. This is the IEEE-standard version. The author of some code (or design document) presents it to peers. People ask questions, flag inconsistencies, point out logic gaps. No moderator required. No formal rulebook. Just collaborative scrutiny.
Each version serves a different purpose. A junior developer develops intuition by painstakingly tracing a loop. A senior dev stepping through an unfamiliar codebase with a debugger builds map knowledge. A team doing a walkthrough meeting builds shared understanding and catches assumptions nobody’s stated out loud.
What Trace Tables Are (And Why CS Teachers Love Them)
A trace table is the structured version of manual tracing. You draw columns — one per variable, one for output, sometimes one for the current line number — and fill in values as you simulate execution.
Let’s say you have a loop that accumulates numbers. Your trace table tracks the running total after each iteration. If your expected total doesn’t match what the program produces, you now have an exact log of where the divergence happened. It’s tedious. It works.
These tables show up constantly in AP Computer Science exams, university CS courses, and coding interview prep. They’re also brutally effective for finding off-by-one errors, which are among the most common and most embarrassing bugs a developer can ship.
The Logging vs. Tracing Confusion (Let’s Clear This Up)
People use “logging” and “tracing” interchangeably. They’re not the same thing.
Logging tracks discrete events — an error happened here, a user logged in there, a transaction failed at this timestamp. It’s retrospective and event-driven. Consider it a highlight reel.
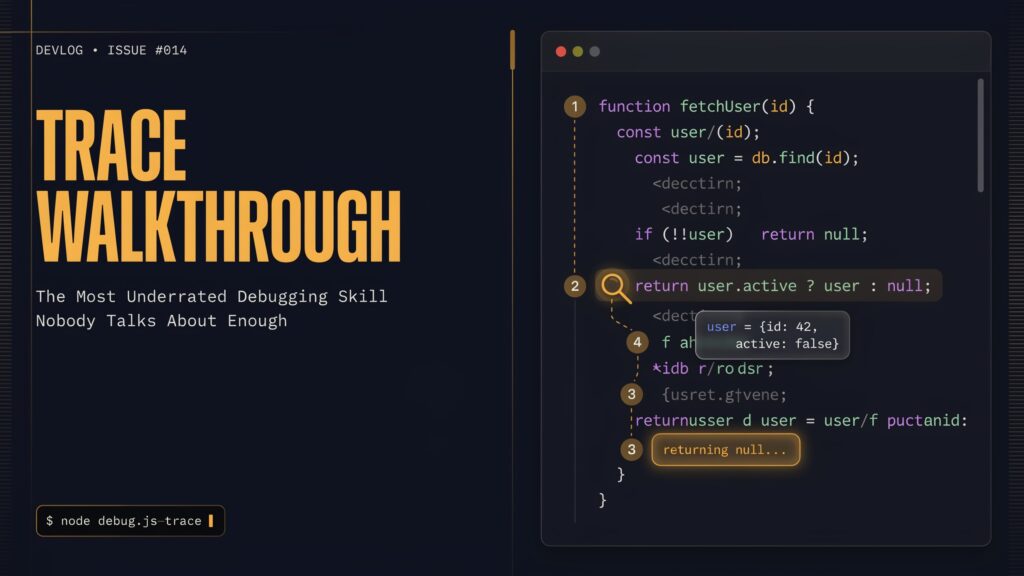
Tracing follows continuous execution flow. It records the path a program took through its own logic — which functions were called, in what order, what data moved between them, and how long each step took. It’s more like a play-by-play broadcast than a highlight reel.
Tracing also, critically, runs on a separate thread from the main code. That matters in performance-sensitive environments — it means you can observe without meaningfully distorting what you’re observing. Logging embedded in main code doesn’t always offer that luxury.
Know the difference. For the right problem, use the appropriate tool.
How AI Just Made This 10x More Complicated
Here’s the twist nobody saw coming fifteen years ago.
The same tracing concepts that CS professors used to teach with pencil and paper? They’re now the bedrock of an entire industry of AI observability tools. Modern AI agents — the ones doing multi-step tasks autonomously — fail in ways traditional debugging literally cannot catch. The agent might retrieve the wrong document, call the wrong API, or hallucinate a response, all while returning a clean HTTP 200 to your monitoring dashboard. Everything looks fine. Nothing is fine.
That’s where AI trace walkthroughs come in. Tools like LangSmith, Arize Phoenix, and Braintrust now capture full execution traces across every model call, tool invocation, and retrieval step. You can literally walk through what your AI agent did, decision by decision. Sound familiar? It should. It’s the same concept — just applied to non-deterministic systems that don’t have “line numbers” in the traditional sense.
The AI testing market, by the way, is projected to jump from around $415 million in 2024 to $2.3 billion by 2032. A big chunk of that growth is trace-based observability. The old idea scales bigger than anyone predicted.
The Walkthrough vs. Inspection Debate
People in software quality circles still argue about this. Code walkthroughs versus formal code inspections — which is better?
Quick breakdown. A walkthrough is informal. The author leads. There’s no rigid structure. People give feedback, raise questions, suggest things. It’s collaborative and loose.
An inspection is formal. There are defined roles — moderator, author, reviewers, recorder. Checklists exist. Findings get documented. It’s more rigorous and more expensive.
The interesting finding from research: lightweight walkthroughs catch roughly as many bugs as formal inspections. They are quicker, less expensive, and less likely to make the writer feel questioned. The trade-off is consistency — informal processes depend heavily on who shows up and how much prep they did.
For most teams, walkthroughs win on cost-effectiveness. For regulated industries (aerospace, medical devices, automotive), inspections are often mandatory. Context matters.
One thing both approaches agree on: managers shouldn’t sit in on walkthrough sessions. Their presence changes the dynamic. People start performing for the room instead of genuinely analyzing the code. Keep the meeting technical.
The Part Where I Challenge Some Popular Assumptions
People assume that once you have a debugger, trace walkthroughs are obsolete. Wrong.
Debuggers only work on running code. You can’t debug pseudocode before it’s implemented. You can’t debug someone else’s architectural decision using breakpoints. You can’t use a tool like GDB to evaluate whether your loop termination condition actually makes sense for all inputs before you write the loop. Manual tracing can do all of those things.
Here’s another one: people assume that experienced developers don’t need to trace. Research data disagrees. A study involving 458 developers found that even experienced engineers actually spent less time in the debugger than expected — many preferring print statements and mental simulation. Experience doesn’t eliminate the value of tracing. It changes how it gets done.
And the biggest assumption: that AI tools will eventually replace all of this. They won’t. Not because AI isn’t powerful — it obviously is — but because tracing is about understanding, not just finding bugs. An AI that pinpoints your error doesn’t teach you why that error reflects a gap in your mental model. The walkthrough does.
Real World: When Trace Walkthroughs Save You
Picture this. You’ve got a bug in production. Your logs show a failure but the error message is vague. Your unit tests pass. Your monitoring says the system is up. But users are complaining.
This is exactly the scenario where automated tooling hits a wall and human trace walkthrough skills matter. You pull the relevant code, sit down, and manually walk through the execution path for the failing input. Variable by variable. Condition by condition. You find that an edge case involving a null value at position three in a data structure was never handled — and every test you wrote assumed non-null input at that position.
No amount of AI-generated test coverage would catch that specific combination without exhaustive fuzzing. But someone walking through the code with the failing input in hand? They’d catch it in twenty minutes.
The Future of Trace Walkthroughs
Trace walkthroughs aren’t going anywhere. They’re shapeshifting.
The manual pencil-and-paper version still matters in education. It’s how new developers build the mental models that make them good at their jobs. Skipping it produces developers who can use tools but can’t think without them.
The tool-assisted version is exploding in scope. Time Travel Debugging — tools like WinDbg’s TTD — let you record an entire execution and then play it backward. You can literally reverse through your program’s history looking for the moment corruption occurred. That’s a trace walkthrough with a rewind button.
The AI agent version is brand new and rapidly maturing. The same principles — capturing execution paths, surfacing decisions, reconstructing what happened — now apply to systems that make probabilistic choices rather than deterministic ones. That’s philosophically wild. And it works.
Whatever shape it takes, the core discipline is constant. Slow down. Follow the logic. Don’t assume. Verify.
Final Words
The tech industry has a dangerous obsession with automation over understanding. We build tools to do things faster and then forget to ask whether we actually understand what those things are.
Trace walkthrough is correct. It’s uncomfortable because it’s slow. It’s valuable because slowness forces attention. Any developer who can’t trace a moderately complex loop on paper is operating on borrowed understanding — they know the code works until the day it doesn’t, and then they’re stuck.
Learn to trace. Do it manually at least sometimes. Then yes — use your debugger, your observability tools, your AI assistants. But don’t let those tools be a substitute for actually knowing what your code is doing.
That’s the gap that breaks systems at 3am. Close it.
FAQs
1. What exactly is a trace walkthrough in software engineering?
It’s the process of stepping through code manually — or with a debugger — tracking the value of every variable and the path of execution at each step. The goal is to understand what the code actually does, not just what you think it does.
2. Is trace walkthrough the same as code review?
Related but different. Code review is about evaluating quality, style, and correctness from a high level. A trace walkthrough specifically follows execution logic step by step. A good code review often includes elements of trace walkthrough for complex sections.
3. Do professional developers still do manual hand tracing?
Yes — more than they admit. Mental simulation of code is something experienced developers do constantly. The formal pencil-and-paper version is more common in education and in debugging without access to a running environment.
4. What’s a trace table and when should I use one?
A trace table is a grid where columns represent variables and rows represent each step of execution. Use one when dealing with loops, recursion, or any logic where variables change frequently and you’re losing track of their current state.
5. How is tracing different from logging?
Logging captures discrete events — errors, state changes, specific moments. Tracing captures the continuous execution flow — the full path through code including all function calls, data movement, and timing. Tracing gives you the narrative; logging gives you the highlights.
6. Is a code walkthrough meeting the same thing?
A code walkthrough meeting is a team-based peer review where the author presents code or design documents to colleagues who ask questions and flag issues. The “trace” element is there — the group mentally follows the logic — but the social and collaborative dimensions are also central to the process.
7. Why don’t debuggers completely replace trace walkthroughs?
Debuggers work on running code. Trace walkthroughs can be applied to pseudocode before implementation, to design documents, to architectural decisions, and to scenarios that are hard to reproduce in a running environment. They also build intuition in a way passive tool use doesn’t.
8. Should managers attend code walkthrough sessions?
Generally no. Their presence tends to shift the focus from technical analysis to performance. The session becomes about how the code looks rather than how it works. Keep walkthroughs technical and peer-to-peer.
9. How does trace walkthrough connect to modern AI observability?
AI agent debugging relies on capturing the full execution trace of an agent’s decisions — which tools it called, what context it retrieved, where it went wrong. The concept is directly descended from traditional trace walkthrough. The discipline is the same, but the instruments are more recent.
10. Can AI tools replace trace walkthroughs eventually?
Probably not fully. AI can find bugs and surface patterns in traces. But the understanding that comes from walking through logic yourself — building mental models, identifying structural flaws, questioning assumptions — isn’t something a tool can do for you. It’s a thinking skill, not an output.
11. What’s the easiest way to start practicing trace walkthroughs?
Take a small function — 10 to 20 lines — and run it by hand on paper with a specific input. Track every variable. Predict the output before running it on a computer. Then run it and compare. Do this regularly and your debugging instincts will sharpen noticeably.
12. Is there a right or wrong way to format a trace table?
Not strictly. The most common format puts variables in columns and execution steps in rows. Some people add a column for line numbers, a column for output, or notes on conditions being evaluated. Adapt it to what’s confusing you in the code.
Keep discovering, connecting, and thriving with The Nexus Magazine every day.